Apple vs Samsung Marketing Strategy: The Complete Comparison (2026)
Brand positioning, ad spend, comparative advertising, retail experience, and a full 15-year global smartphone market share history between the industry’s two biggest rivals.


No rivalry in consumer technology has shaped modern marketing thinking more than Apple versus Samsung. Two companies, two philosophies, and — depending on the quarter you check — two genuinely different answers to “who’s actually winning.” Apple’s brand is valued at roughly $947 billion, the most valuable brand on the planet by most rankings, built on a narrow, premium, emotionally-driven strategy. Samsung, meanwhile, outspends nearly every competitor in raw marketing dollars, runs a chaebol-scale advertising operation across every price tier, and has held the global smartphone shipment lead for most of the past fifteen years.
The two companies are also, famously, “frenemies.” Apple buys advanced OLED panels from Samsung Display for iPhones, and credible reporting points to Samsung Display supplying the foldable OLED panels for Apple’s first foldable iPhone, expected around 2026 — a textbook case of co-opetition: fierce rivals in the market, pragmatic partners in the supply chain.
This guide breaks down both sides of the rivalry in full: brand positioning and philosophy, marketing spend and channel structure, comparative advertising history, retail and event strategy, and — in the most requested part of any Apple-versus-Samsung comparison — a detailed, year-by-year look at how global smartphone market share has shifted between the two over the past fifteen years, through the most current data available. Case studies at this scale are exactly the kind of research that informs the frameworks behind our digital marketing strategy consulting services in USA work — real brand comparisons, not theory, are usually what actually changes how a positioning decision gets made.
A note on the data. Market share figures below are compiled from IDC, Counterpoint Research, Gartner, Canalys, and Statista reporting and are presented as rounded approximations. Firms sometimes differ by a percentage point or two depending on methodology, and quarterly figures can diverge meaningfully from full-year figures — Samsung’s broader portfolio often leads on a quarterly basis while Apple’s concentrated flagship cycle can dominate specific quarters. Treat the table as directional, not to-the-decimal precise.
Apple vs Samsung, by the Numbers
*Sources: Advergize Samsung Marketing Strategy analysis, Interbrand/brand valuation reporting, Fortunly, Statista, IDC.
Two Philosophies: Narrow and Premium vs. Broad and Diversified
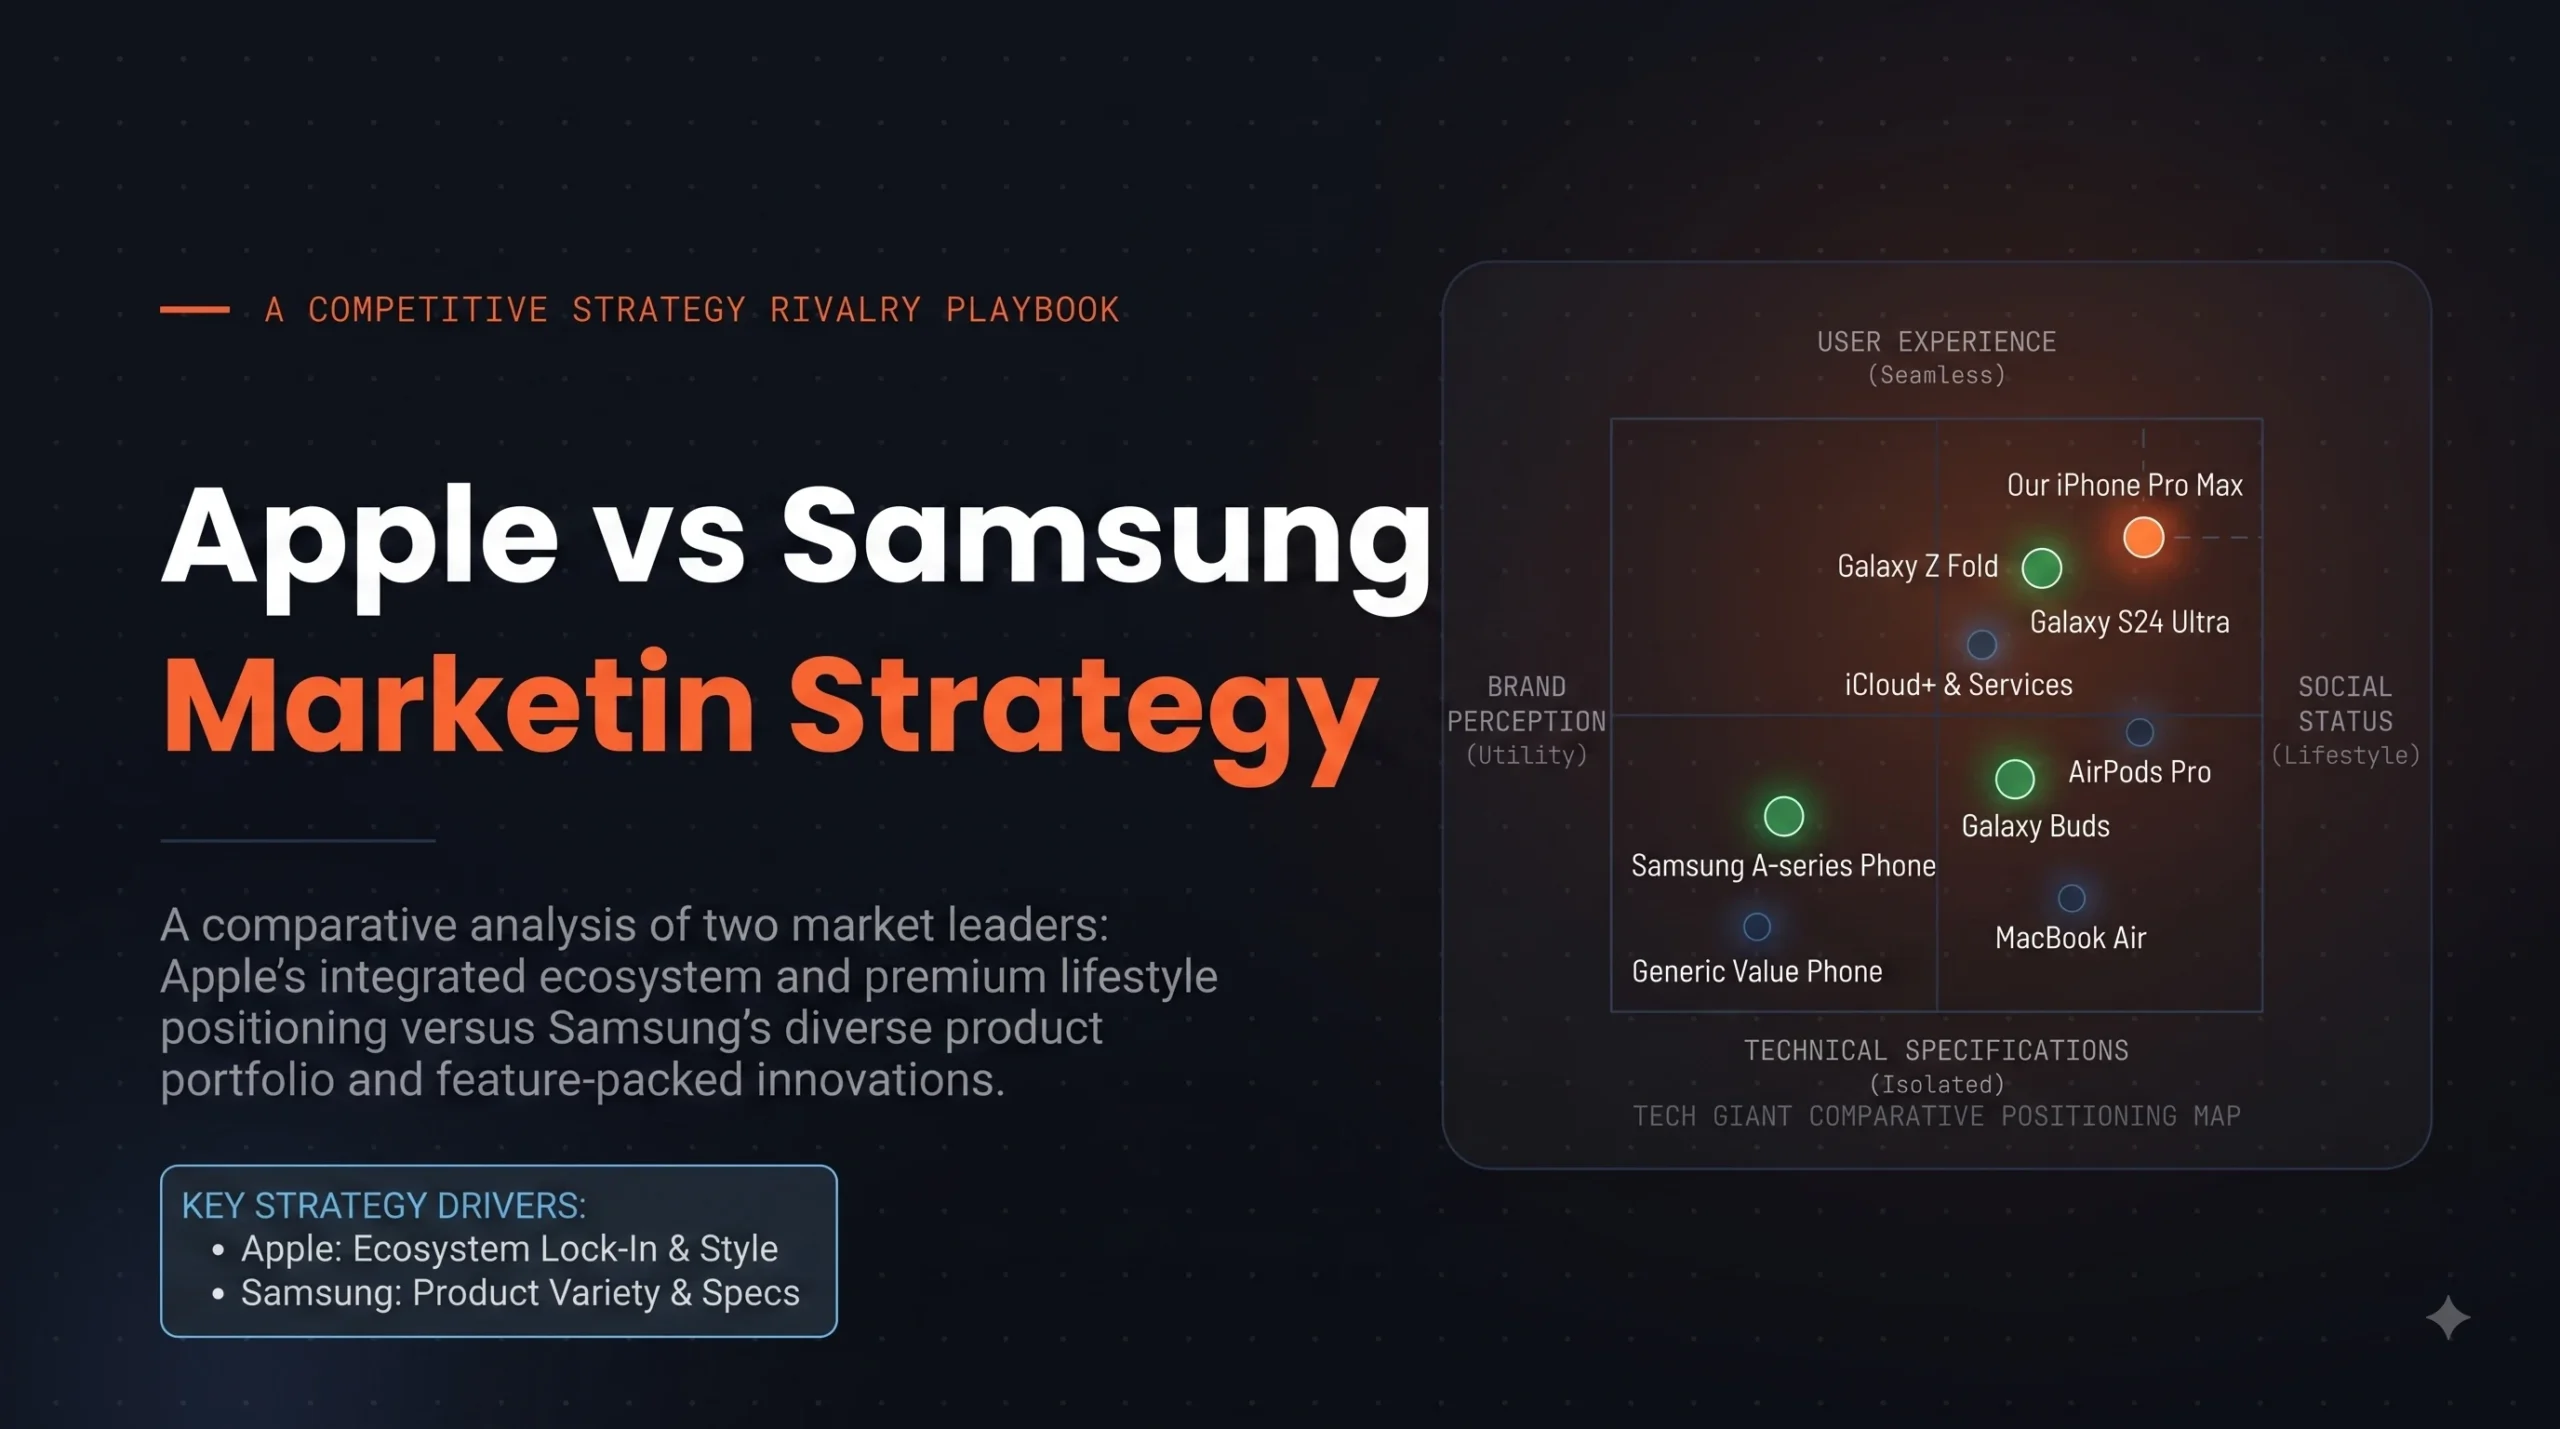
Every tactical difference between these two companies traces back to one strategic fork: Apple sells to a narrow, premium audience with a single flagship story per year; Samsung sells to nearly everyone, across every price point, with a portfolio spanning budget A-series phones to folding premium devices.
Apple
- Narrow, premium target audience
- Minimalist, white-background creative
- Emotional storytelling over spec-sheets
- Ecosystem lock-in across devices
- One flagship launch narrative per cycle
- Owned retail as a core marketing channel
Samsung
- Broad audience across every price tier
- Feature-forward, comparative creative
- Aggressive competitor call-outs by name
- Diversified device and price portfolio
- Multiple product-line launches per year
- Mass reach: TV, programmatic, Samsung Ads
Neither approach is objectively “better” — they’re built for different economics. Apple’s narrower funnel supports premium pricing and industry-leading margins; Samsung’s diversified funnel supports the volume needed to remain the world’s largest smartphone maker by units shipped in most years. Both strategies show up directly in the market share data later in this guide.
Marketing Spend, Channels, and Data Strategy
Samsung’s chaebol structure funds a marketing budget that, by some comparisons, exceeds the total annual revenue of many consumer electronics competitors combined. The company leans heavily on television for mass reach across diverse demographics and income levels — a deliberate choice, since Samsung has to reach a far wider audience than Apple’s premium-only funnel requires. On digital, Samsung relies heavily on programmatic, data-driven targeting: first-party data pulled from its enormous installed base (smartphones, Smart TVs, wearables) feeds personalized campaigns at a scale few competitors can match, and a Google Marketing Platform case study reported Samsung achieved a 173% improvement in return on ad spend through data-driven creative optimization alone. Samsung also operates its own advertising platform, Samsung Ads, monetizing its Smart TV installed base directly.
Apple’s measured ad spend is comparatively smaller and more concentrated — fewer campaigns, released less frequently, built around major product moments rather than continuous mass-reach advertising. What Apple spends less on in traditional media, it makes up for in owned channels: the Apple Store network, product launch keynotes, and a retail experience designed to function as marketing in its own right. This is a live illustration of how differently two companies can weight the same owned, earned, and paid channel categories — the kind of allocation decision covered in more general terms in our guide to marketing channel strategy, where the same owned/earned/paid framework explains why Samsung leans paid-and-broad while Apple leans owned-and-narrow.
Comparative Advertising: The Rivalry as Content
Samsung has built an entire advertising tradition out of positioning itself directly against Apple — parodying the queues outside Apple Stores on launch day, timing “Growing Up” and “Next Big Thing”-style campaigns to land during iPhone launch windows, and seeding culturally-aware content the moment Apple takes the spotlight. It’s a classic challenger-brand move: stay in the leader’s spotlight by design, stretching the media value of every Apple launch into a Samsung marketing moment as well.
Apple has occasionally responded in kind rather than staying entirely above the fray — including a print ad alluding to allegations that Samsung had copied Apple’s product ideas, timed to coincide with ongoing patent litigation between the two companies. These moments are rare for Apple compared to Samsung’s near-constant comparative posture, which itself reflects the underlying philosophy difference: the challenger brand benefits from a visible fight; the category leader generally doesn’t need one.
Rivals on the shelf, partners in parts. Apple and Samsung compete ferociously in public while collaborating in the supply chain — and that tension has fueled some of the most studied marketing campaigns, ambush stunts, and courtroom drama in modern brand history.
Get More Brand Strategy Case Studies
Join thousands of marketing leaders getting our weekly playbook — brand positioning breakdowns, competitive strategy, and channel benchmarks — straight to your inbox.
Retail and Event Marketing: Store as Stage
Both brands treat physical and live experience as core marketing infrastructure, not an afterthought. Apple Stores are deliberately minimalist, staffed for consultative rather than transactional selling, and function as a continuous brand experience rather than a pure sales channel — the retail environment reinforces the same simplicity and premium positioning found in Apple’s advertising. Product launch keynotes extend the same idea into a media event: a single, tightly-controlled narrative delivered directly to a global audience.
Samsung leans on Galaxy Unpacked events to generate a comparable media moment for its flagship launches, alongside Samsung Experience Stores that showcase the breadth of its ecosystem — phones, tablets, wearables, TVs, and appliances — in a single space, reflecting the company’s diversified-portfolio strategy even in its retail footprint. Where Apple’s retail experience emphasizes focus, Samsung’s emphasizes range.
Brand Loyalty and Ecosystem Strategy
Apple’s ecosystem is arguably its single strongest marketing asset, even though it rarely gets discussed as “marketing” directly. iMessage, AirDrop, Handoff, and cross-device continuity create genuine switching costs that a purely feature-based comparison with any Android device can’t capture — and Apple’s marketing consistently reinforces that ecosystem story rather than competing on individual spec sheets. The result is some of the highest customer loyalty and retention figures in consumer electronics.
Samsung’s version of loyalty looks different: rather than locking users into a single tightly-controlled ecosystem, it captures customers across their entire lifecycle by offering a device at nearly every price point — a customer might start on a budget Galaxy A-series phone and move up to a flagship Galaxy S or Z-series model years later, all while staying within the Samsung brand. It’s ecosystem thinking applied to price tier and life stage rather than device interoperability.
The 15-Year Market Share History: 2011 Through 2026
This is the story most people actually want when they compare these two companies — and it’s more dynamic than either brand’s marketing message alone would suggest. Global smartphone market share has swung meaningfully over the past decade and a half, shaped by product cycles, one major recall crisis, the rise and fall of Huawei, and — in the most recent three years — a genuine, historic reversal.
| Year | Samsung | Apple | What happened |
|---|---|---|---|
| 2011 | ~19% | ~19% | Samsung overtakes Nokia as the leading handset vendor late in the year; Android becomes the world’s #1 smartphone OS |
| 2012 | ~30% | ~19% | Samsung cements global #1 position on the strength of the Galaxy S III |
| 2013 | ~31–32% | ~15–19% | Samsung’s historic peak share — never surpassed since by any single vendor |
| 2014 | ~24–25% | ~15% annual (20.4% in Q4) | iPhone 6/6 Plus makes Apple briefly #1 in Q4 — first time since 2011 |
| 2015 | ~22–24% | ~16–17% | Market matures; Chinese vendors begin emerging |
| 2016 | ~21% | ~14–15% | Galaxy Note7 battery crisis triggers a global recall |
| 2017 | ~21% | ~14–15% | iPhone X marks the 10th-anniversary redesign |
| 2018 | ~20% | ~14–15% | Huawei and Xiaomi gain significant global share |
| 2019 | ~21% | ~13–14% | Huawei briefly overtakes Apple in global unit sales |
| 2020 | ~19–20% | ~15–16% | US sanctions cripple Huawei; pandemic disrupts shipments |
| 2021 | ~20% | ~17% | Apple gains share as Huawei’s collapse reshapes the field |
| 2022 | ~21–22% | ~18–19% | Premium segment growth continues to favor Apple |
| 2023 | ~19–20% | ~20% | Apple becomes the world’s top vendor by full-year shipments for the first time in 12 years |
| 2024 | ~19–20% | ~18–19% | The closest annual race in over a decade |
| 2025 | 241.2M units | 247.8M units | Apple edges Samsung for a third consecutive year on full-year unit shipments; Galaxy S25 AI series and iPhone 17 both post strong demand |
| 2026 (Q2) | 22.6% | 21.1% | Samsung regains the quarterly global lead even as Apple leads on recent full-year totals |
Reading the trend line
Four distinct eras stand out across those fifteen years:
- The ascent (2011–2013). Samsung’s rise from roughly 19% to a peak above 30% remains the fastest climb to global smartphone leadership any single vendor has achieved — a share level no company has matched since.
- The plateau and Chinese challenge (2014–2020). Samsung settled into a stable 19–22% band while Apple hovered in the mid-teens, even as Huawei’s rapid rise — and equally rapid collapse under US sanctions — reshaped the rest of the field around both leaders.
- Apple’s climb (2021–2022). As Huawei exited the premium conversation, Apple steadily gained share, closing the gap with Samsung from roughly ten points down to just two or three.
- The historic reversal (2023–2025). For the first time since 2011, Apple became the world’s top smartphone vendor by full-year unit shipments — and has now held that position for three consecutive years, even as Samsung frequently reclaims the quarterly lead thanks to its broader, more consistently-timed product cadence.
The regional picture adds important nuance the global numbers alone don’t capture. As of early 2026, Samsung’s US smartphone market share sits at roughly 28.4%, compared to Apple’s commanding 58.2% — meaning Samsung’s global leadership is built substantially on strength outside the US, while Apple’s position in its home market remains extraordinarily dominant regardless of the global horse race.
What Other Brands Can Actually Learn From This Rivalry
Strip away the product specifics and the Apple-versus-Samsung rivalry is a fifteen-year case study in two coherent, sustained strategic positions — neither company has meaningfully drifted from its core philosophy despite constant pressure to imitate the other. That consistency, more than any single campaign, is probably the biggest lesson: Apple never chased Samsung’s breadth, and Samsung never chased Apple’s narrowness, even during the years each was losing ground.
For most businesses, the more useful question isn’t “which strategy is better” but “which strategy matches our actual economics” — the same category-leader-versus-challenger-brand calculus that shapes strategy far beyond consumer electronics. Applying lessons this specific and this data-heavy to an individual business is exactly the kind of work worth getting outside perspective on; our overview of digital marketing strategy consulting services in USA markets is a useful starting point for brands wanting to translate a case study like this into an actual positioning decision for their own category.
The channel-allocation lesson is just as concrete: Samsung’s paid-and-broad approach and Apple’s owned-and-narrow approach both work because each is internally consistent across every channel the brand touches — advertising, retail, events, and digital all reinforce the same story rather than sending mixed signals. That kind of cross-channel coherence is precisely what our guide to marketing channel strategy is built around, and it’s worth revisiting with this rivalry in mind: the specific channels matter less than whether they all agree with each other.
Common Misconceptions About This Rivalry
- Assuming market share alone determines “winning” — Apple has led on profit and brand value for most of the past decade despite trailing Samsung on units for most of it
- Treating Samsung’s ad spend as undisciplined — it’s a deliberate, mass-reach strategy suited to a diversified portfolio, not a lack of focus
- Assuming Apple doesn’t compete on price — Apple’s older iPhone models, kept on sale at reduced prices, quietly compete in the mid-tier Samsung dominates
- Missing the regional split — global share figures obscure Apple’s overwhelming dominance in the US market specifically
- Overlooking the supply-chain relationship — the two companies cooperate closely on components even while competing fiercely on marketing
- Assuming quarterly share swings signal a permanent shift, when Samsung and Apple’s product cadences naturally trade the quarterly lead back and forth
Final Thoughts
Fifteen years of data make one thing clear: there’s no single “winning” strategy between narrow-and-premium and broad-and-diversified — there are two different, internally coherent bets on how a global consumer technology brand can build durable value. Samsung’s climb from 19% to a 30%+ peak share in three years remains one of the fastest ascents to category leadership in consumer tech history. Apple’s return to the top of the annual shipment table in 2023, after twelve years of trailing on units while consistently leading on brand value and margin, is just as significant a story in the opposite direction.
What both companies share matters more than what separates them: total consistency in their positioning, marketing built to reinforce that positioning across every channel rather than chase short-term trends, and a willingness to let the other brand’s spotlight become part of their own story — Samsung explicitly, Apple more selectively. That discipline, sustained across a decade and a half of product cycles, competitor collapses, and one major product recall, is the real marketing lesson this rivalry keeps teaching.
Whichever side of the philosophy your own brand is closer to — narrow and premium, or broad and diversified — the data here suggests the same conclusion either way: pick a lane, build every channel to reinforce it, and hold that position long enough for it to compound. Both Apple and Samsung have proven, from very different starting points, that this is what actually wins over fifteen years.
Frequently Asked Questions
Apply These Lessons to Your Own Brand
Get a free growth audit from TwoFold USA — and a positioning and channel strategy built with the same consistency that defines the industry’s biggest brands.
Get Free Growth Audit